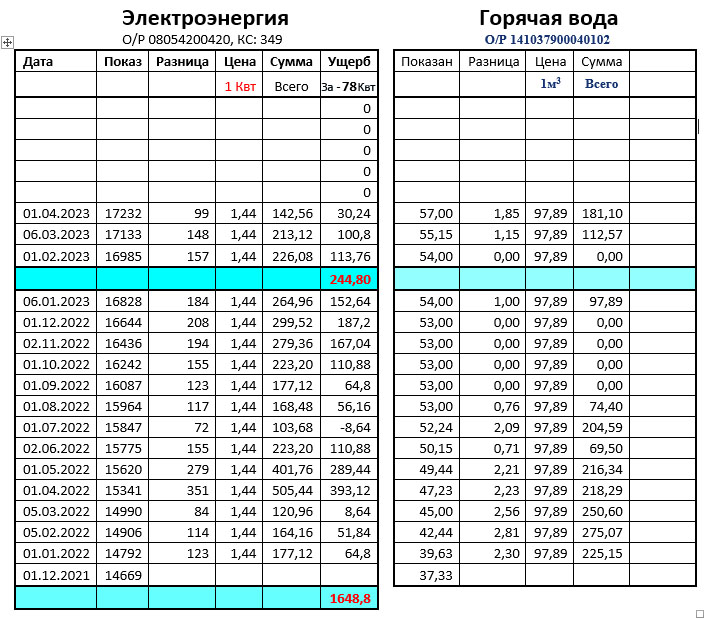
Damage
1 – Temperature t graph for g. Kyiv.
On the right side – Full t chart for r. Kyiv for outdoor air from +10 to -22 degrees Celsius, where: – tп – The temperature of the heat carrier in the supply pipeline at the point of consumption, tн – Outdoor temperature, tо – Return temperature from the point of consumption
2 – t – scheduled for tн in tп and tо
3 – Date of measurements and readings of actual measurements tп,tн,tо
4 – Indicators for explaining the undue benefit
u6-k4k-02-03.04.23
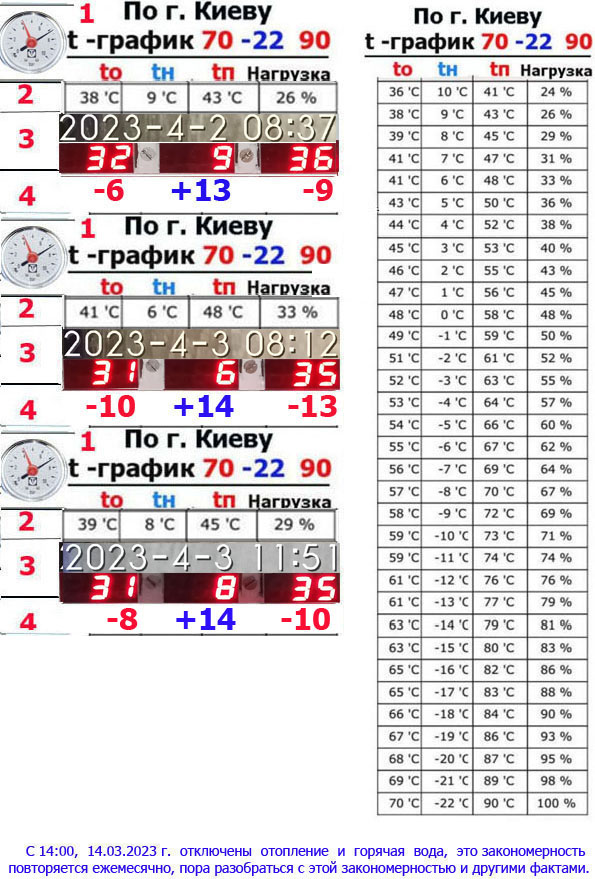
u6-k4k-29-31.04.23
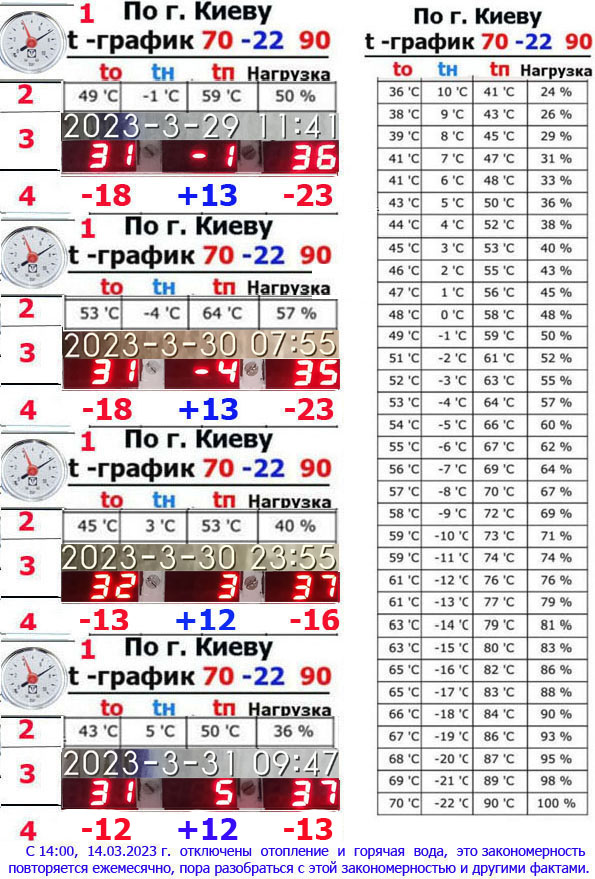
u6-k4k-27-29.03.23
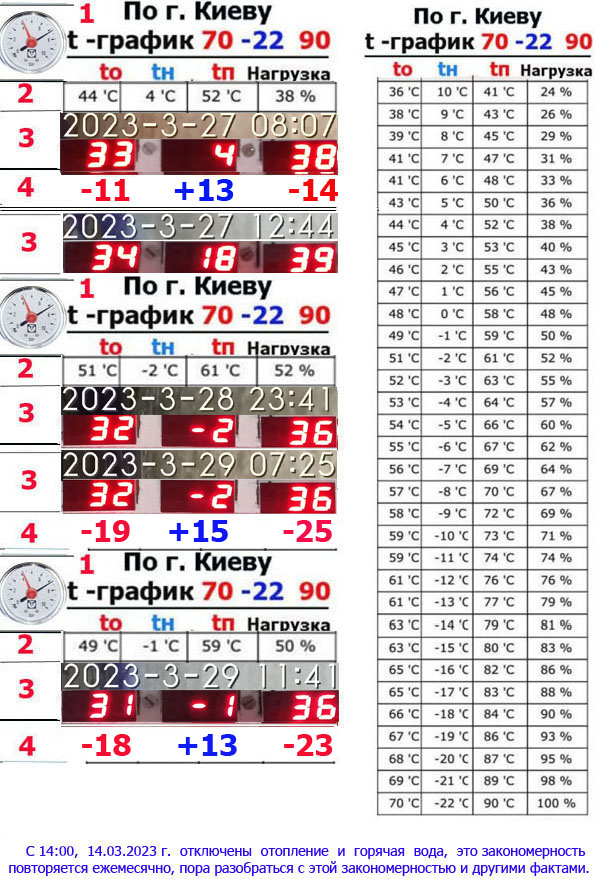
u6-k4k-13-15.03.23
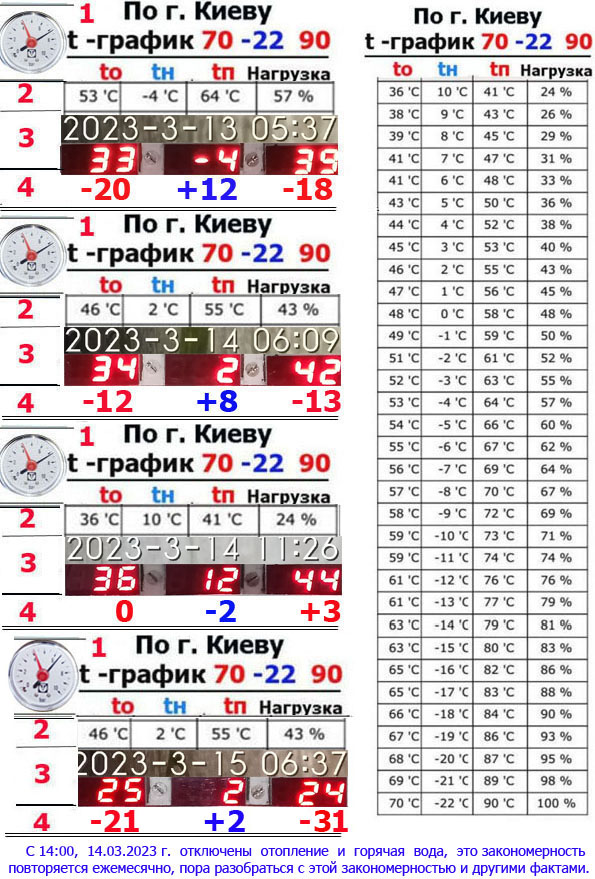
u6-k4k-19-23.11.22
NSE: u6-tso-23.11.22 q.4, building 40b, where: NSE – Independent system expertise; u6 – Monitoring; tso – heating supply; 23.11.22 – the date of the; kv.4, building 40b – location;
1 – Temperature t graph for g. Kyiv.
On the right side – Full t chart for r. Kyiv for outdoor air from +10 to -22 degrees Celsius, where: – tп – The temperature of the heat carrier in the supply pipeline at the point of consumption, tн – Outdoor temperature, tо – Return temperature from the point of consumption
2 – t – scheduled for tн in tп and tо
3 – Date of measurements and readings of actual measurements tп,tн,tо
4 – Indicators for explaining the undue benefit
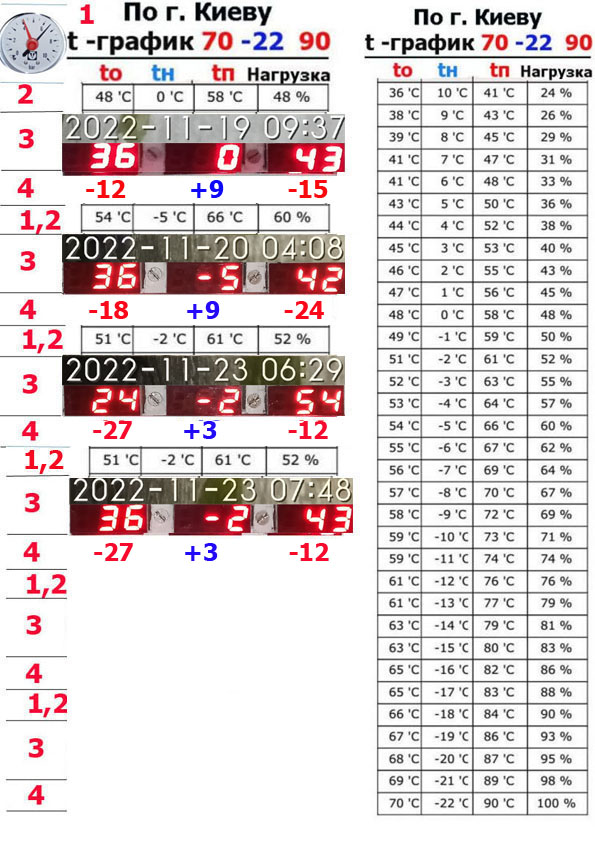
u6-k4k-14-19.11.22
u6-k4k-14-19.11.2022. where: u1 – Heating monitoring; k4k – along the riser 4, sq.4 for dates 14-19, meyac 11, year 2022 .
1 – Temperature t graph for g. Kyiv.
On the right side – Full t chart for r. Kyiv for outdoor air from +10 to -22 degrees Celsius, where: – tп – The temperature of the heat carrier in the supply pipeline at the point of consumption, tн – Outdoor temperature, tо – Return temperature from the point of consumption
2 – t – scheduled for tн in tп and tо
3 – Date of measurements and readings of actual measurements tп,tн,tо
4 – Indicators for explaining the undue benefit
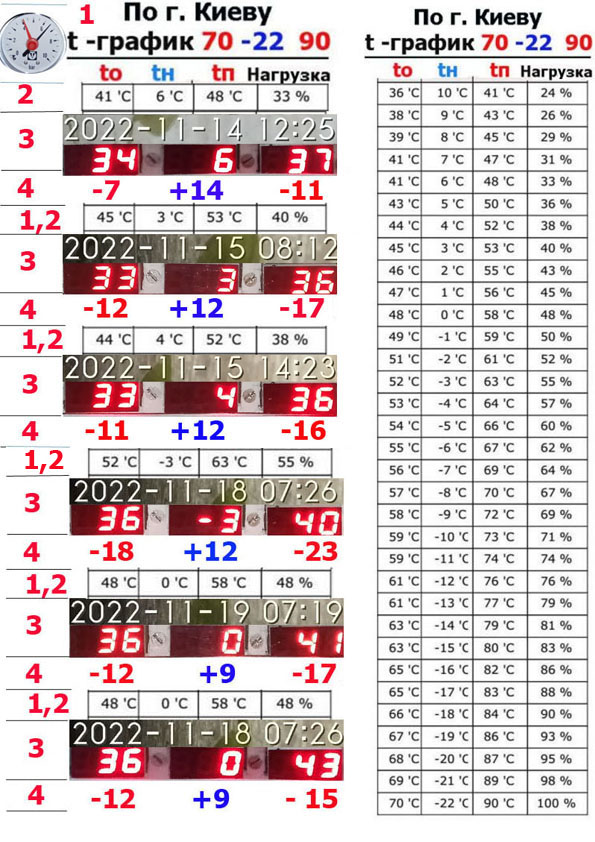
Quarter 4 lives a person classified as a war invalid in accordance with Art.. 13 ZU
PS

1 and mark their completionu6-k4k-03.04.23-14.11.2022r.”